gnuplot19.plt
# gnuplot19.plt
reset
set zeroaxis
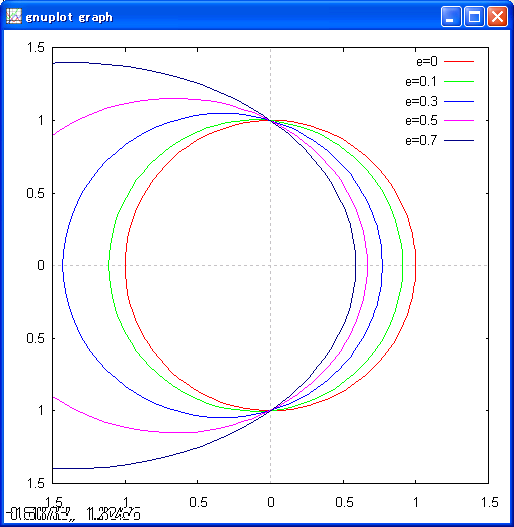
set polar
l=1; f(t)=l/(1+e*cos(t))
set xrange [-1.5:1.5];set yrange [-1.5:1.5];set trange [-pi:pi]
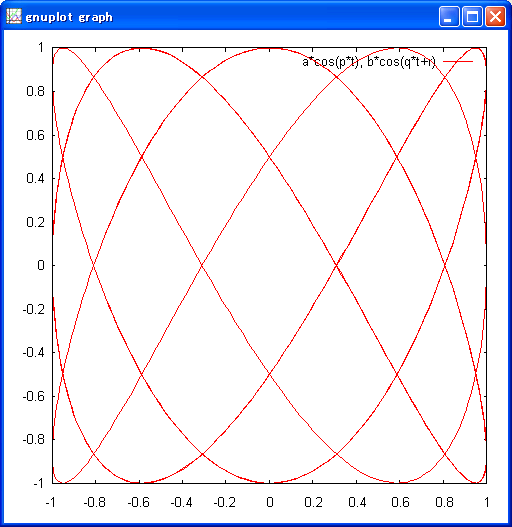
plot e=0, f(t) title "e=0", \
e=0.1, f(t) title "e=0.1", \
e=0.3, f(t) title "e=0.3", \
e=0.5, f(t) title "e=0.5", \
e=0.7, f(t) title "e=0.7"
gnuplot20.plt
# gnuplot20.plt
reset
set zeroaxis
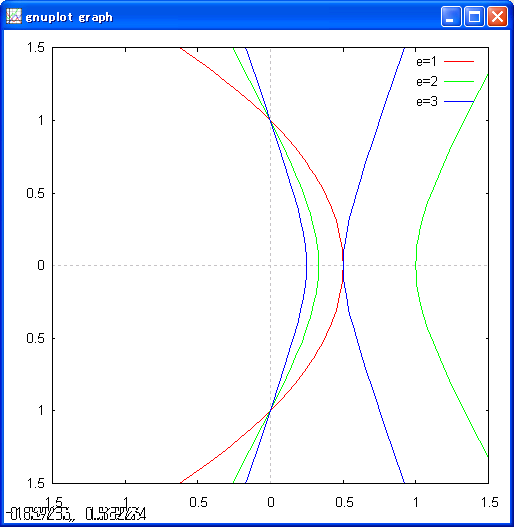
set polar
l=1; f(t)=l/(1+e*cos(t))
set xrange [-1.5:1.5];set yrange [-1.5:1.5];set trange [-pi:pi]
plot e=1, f(t) title "e=1", \
e=3, f(t) title "e=2", \
e=5, f(t) title "e=3"
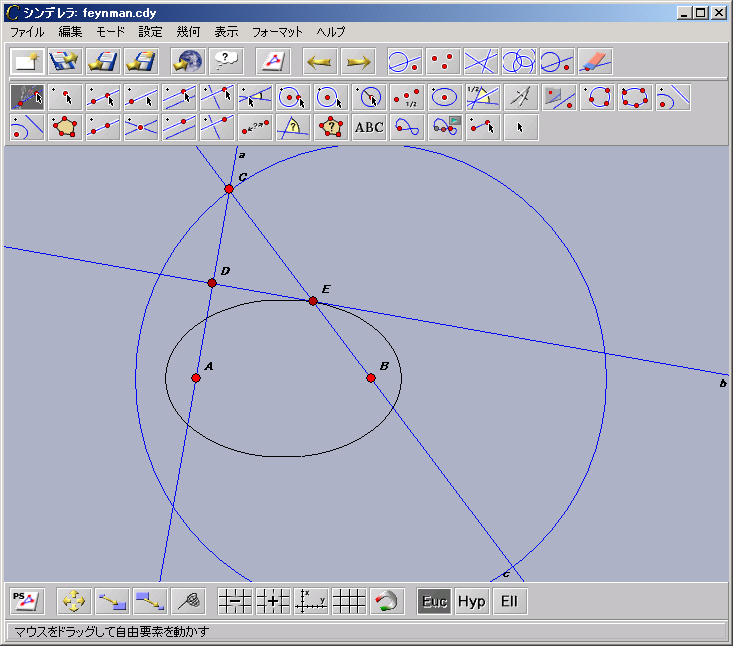
ケプラー運動(惑星の運動)のシミュレーション.
点 C は,点 A を中心とする円周上を一定速度で運動する.
このとき,
線分 CB の垂直二等分線と線分 AC の交点 E は,
点 A, B を焦点とする楕円上を運動する.
点 E の運動は一様でないことに注意せよ
(点 B のまわりの面積速度が一定になる).
↓下の画像をクリックするとアニメーションがはじまる.